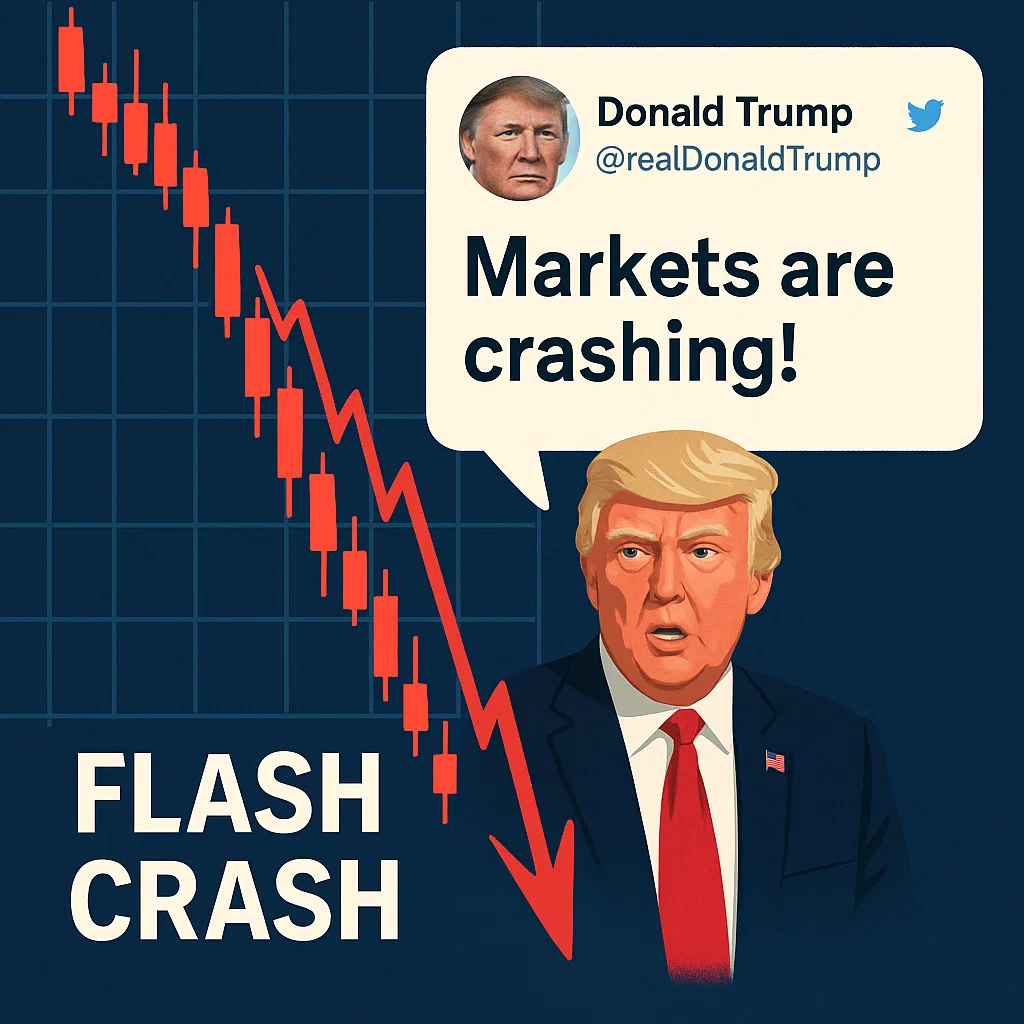
A flash crash was induced after a Donald Trump tweet. This is not the first or last time this happens. When a high profile post shocks sentiment, it triggers market sells offs, and drains liquidity within minutes. As prices slip through support, clustered stops fire and leveraged long positions face automatic liquidations. It’s painful if you play with leverage and emotionally testing if you just spot crypto.
The chain of events yesterday evening, caused a reaction into a rapid cascade, which is why losses accelerate even if the tweet itself is brief or ambiguous. Prices did recover somewhat but not to the level of prices previously marked.
What Is A Flash Crash In Crypto
A flash crash is a sudden, sharp price drop over minutes or seconds. It often starts when aggressive selling hits thin order books, slippage rises, and bids vanish. In crypto, round the clock trading and common use of leverage make these moves faster and deeper than in traditional markets.
The Chain Reaction Sequence In A Nutshell
- Sentiment Shock: A high profile tweet can shift risk appetite instantly. Traders front run perceived policy or regulatory risk and sell quickly.
- Liquidity Vacuum: Market makers widen spreads and retail bids pull. With fewer resting orders, small sells move price a lot.
- Stop Cascades: As price breaks recent lows, clustered stop losses get triggered.
- Derivative Spillover: Perpetuals see long positions auto deleveraged as margin erodes. Liquidation engines market sell collateral, pushing price down further.
- Feedback Loop: Falling price begets more liquidations and more selling.
Why Long Positions Get Wiped So Quickly
Leverage magnifies both gains and losses. So when shit hits the fan, the move snowballs:
- Margin ratio falls toward maintenance levels.
- Exchanges start partial then full liquidation to cover risk.
- Liquidations execute as market orders into thin books.
- Each liquidation pushes price lower and trips the next batch.
A Minute By Minute View Of A Typical Event
- T0 To T+1 Minute: Tweet hits. Spot sells increase. Spread widens.
- T+1 To T+5: Key supports break. Stops and small liquidations begin.
- T+5 To T+20: Largest long clusters unwind. Open interest contracts. Funding flips toward shorts.
- T+20 To T+60: Volatility cools. A reflex bounce appears as short term buyers step in and liquidations slow.
Avoid Impulsive Decisions
Wait for the cooldown before action. Plan ahead, follow your checklist, and do not trade on emotion.
Metrics To Watch Before And During A Crash
- Open Interest: Elevated open interest with crowded longs increases liquidation risk.
- Funding And Skew: Positive funding with call heavy skew hints at bullish crowding.
- Order Book Depth: Thin books mean small flows move price.
- Liquidation Heatmaps: Show where long clusters may cascade.
- Stablecoin Inflows And Dominance: Flight to safety signals risk aversion.
Risk Control Management
- Right Size Leverage: Use lower leverage or spot for core positions. Consider no leverage during event risk.
- Plan Your Exits: Place stop losses where the thesis fails, not at round numbers.
- Use Ladders: Scale entries and exits to avoid single price dependency.
- Hedge: Keep a portion in stablecoins and consider protective puts when volatility is cheap.
- Circuit Breakers For Yourself: Predefine max daily loss and stop if it is hit.
- Venue Hygiene: Trade on exchanges with robust engines and deep books. Avoid illiquid pairs during news shocks.
Platform Constraints During Volatility
During extreme moves, some exchanges slow down or become unresponsive. Systems can be overwhelmed by simultaneous transactions, so always have a backup venue and a clear plan.
Tactics To Bounce Without Catching The Falling Knife
- Wait for liquidations to subside and a higher low to print.
- Watch the spot to perpetual basis normalize.
- Confirm with declining liquidation prints and stabilizing open interest.
- Scale in small and let the chart prove strength.
Use clear indicators and the right tools to monitor momentum and liquidity.
Common Questions
Was This Manipulation
Not necessarily. Fast moves in thin liquidity plus leverage can look like manipulation. Proving intent is hard. Focus on structure and risk, not blame.
Can You Predict These Crashes
No one can time the trigger, but you can prepare by monitoring crowding, leverage, and liquidity conditions.
Should Long Term Investors Panic
Usually no. If your thesis spans years, flash crashes can become opportunities. Keep an emergency cash buffer and avoid forced selling.
Key Takeaways
- A Donald Trump tweet flash crash is a textbook case of sentiment shock colliding with leverage.
- Auto liquidations are the accelerant. Manage leverage and define exits before volatility hits.
- Preparation beats prediction. Build a repeatable risk process and stick to it.
- Practice JOMO. The joy of missing out helps you avoid FOMO trades and stick to your plan.
You cannot time the exact top or bottom. Take profits when they align with your plan and do not be greedy.

